
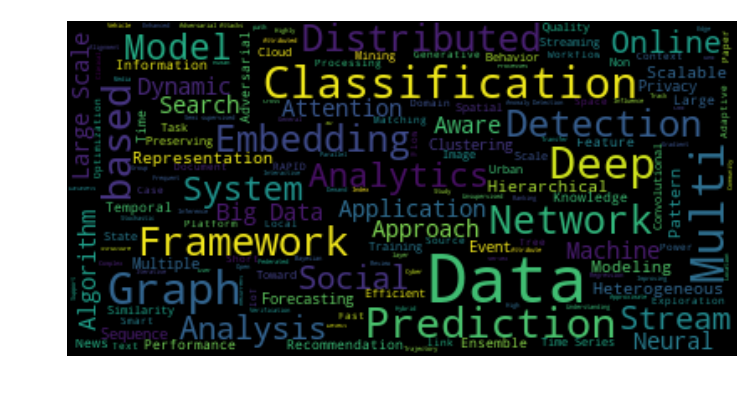
WordCloud visualization of conference topics
Published:
IEEE BigData conference was just over this past Thursday. Do you want to know what is going on currently in big data mining research area? More specifically, the hot research topics/keywords that were discussed in the conference proceedings. Man, wouldn’t it be better if I can see the hot research topics and keywords? Worry no more, this is where word cloud can help you capture the info within seconds.
Here is the code snippet that I used to generate this wordCloud.
from wordcloud import WordCloud

# read source text and do a bit preprocessing
with open("bigdata.txt") as file:
    inputf = file.readlines()
    res = []
    for line in inputf:
        sp = line.split(",")
        res.append(sp[-1])
	res_str = " ".join(res)

	# remove some words that are not interesting
	stopwords = ['based','using','high','learning', "via", "network"]
	querywords = res_str.split()

	resultwords  = [word for word in querywords if word.lower() not in stopwords]
	result = ' '.join(resultwords)

	# create wordcloud with max font size = 40
	wordcloud = WordCloud(max_font_size).generate(result)

	# show the wordcloud
	import matplotlib.pyplot as plt
	plt.imshow(wordcloud, interpolation='bilinear')
	plt.axis("off")
	plt.show()
The sample input file can be seen here. These are the accepted regular paper and short papers in the IEEE BigData 2019 conference. Each line is an individual paper. Note that author names and titles are separated by a comma. You can prepare your own input file by scraping the internet~
You can also see this blog on Medium


